| Disclaimer: | The FinTech team has been thinking about how we can help during this COVID-19 crisis. If you’re trying to leverage COVID-19 data for your analysis and models, this article explains how you can accomplish this by using publicly available data sources. Since stakes are very high at the moment and a lot of things are changing, please refer to our Terms of Use and the last sections of this post. We are trying to help provide some insights, but don’t have any control over data, accuracy or availability of resources, etc. |
Manage Uncertainty with Scenario Planning
Many of you working in Finance, Risk Management or various Data Analytics roles are busy working on Scenario Planning / Scenario Modeling. Uncertainty is the highest it has been in a long time and assumptions are changing rapidly. Scenario planning is a common activity for finance departments, but right now input parameters are changing on a daily basis.
Assumptions from the Outside World
Normally our plans are heavily based on drivers from within our organization. But when a global crisis hits, our assumptions can heavily vary based on influences from the outside world. The factors that are impacting the environment in which we operate can be completely different from what we would consider under normal circumstances.
For some of you, it might be helpful to leverage the statistical data for COVID-19 in your models, for example:
- Number of confirmed cases and deaths by geography
- Cases per Capita (e.g. by 100,000 inhabitants)
- States under Lockdown
These numbers and ratios can be especially helpful when considering associated trends and time series to derive conclusions and identify when and how a situation is changing.
Trying to Help in this Global Health Crisis
The FinTech team has been thinking about how we can help during the COVID-19 crisis. Accessing the statistical data for COVID-19 cases and integrating it into your analytics and planning applications can be quite tricky, take time and requires daily updates.
Since our business focus is on data integration and automation, we have looked into various places from which you can source COVID-19 data into your financial models.
Please note: this post explains how you can get access to the data. It does NOT go into details on how to integrate it. The dataset described below (from data.world) provides several ways how you can access the data.
The link from data.world is here. Take a look at section “Integration and Tools > SDKs and connectors” which explains how to integrate with Snowflake, SQL Server, Azure Synapse, PostgreSQL, Google Big Query, Redshift, Python, R as well as just regular JDBC connectivity.
If these options don’t work for you, please let us know and we’re happy to add another post about how to integrate these data sources.
Available Statistical Data for COVID-19
We are all following the daily changes in confirmed cases and deaths across the globe. Many organizations are working diligently on compiling this data from various sources. At the forefront is Johns Hopkins University. They provide these statistics in a daily file which can be used for educational purposes (please read their terms of use carefully to understand how to use the dataset, how it was compiled and what its limitations are).
Data can be consumed directly from their repository which is available to the public from here: https://github.com/CSSEGISandData/COVID-19/tree/master/csse_covid_19_data/csse_covid_19_daily_reports
Challenges with Processing the Data
While the data is available to the public, accessing it is not straight forward:
- The data format has changed since it was first released on Jan 22, 2020, adding additional fields and modifying nomenclature (e.g. adding latitude/longitude, granularity by county)
- File manipulations and mappings are needed to produce a consistent dataset
- Daily updates need to be considered and processed
- Future changes to the data format and consistency needs to be considered
A Central Repository which is Managed Professionally
BI company Tableau started an initiative, collaborating with several other data companies like Snowflake, Path, Mapbox etc. to create a consistent dataset.
This dataset is available on the data.world platform.
What does this Dataset contain?
As mentioned before, the content of the available data has changed since January 22, 2020. The following table shows the information that can be retrieved. The date in the column header states the first date when the information for the marked columns was available.
| Jan 22 | Mar 1 | Mar 22 | |
|---|---|---|---|
| FIPS | x | ||
| Admin2 | x | ||
| Province/State | x | x | x |
| Country/Region | x | x | x |
| Last Update | x | x | x |
| Latitude | x | x | |
| Longitude | x | x | |
| Confirmed | x | x | x |
| Deaths | x | x | x |
| Recovered | x | x | x |
| Active | x | ||
| Combined Key | x |
Please note: since March 22, information for the US is available by county which is stored in field Admin2.
Two main datasets are offered at the moment:
- Daily Summary: filter on any day between Jan 22 and yesterday (or whenever the latest data is available) to get the point in time information
- Time Series: incremental changes to the previous day
The remainder of this post explains how to access the data from data.world.
Explore COVID-19 Data on data.world
Step 1: Create an Account
Accessing data from data.world and starting to explore it is not very hard. First, you need to create an account for data.world (creating one is really easy, just follow the instructions here, under section “Catalog Shopping with Data.World”)
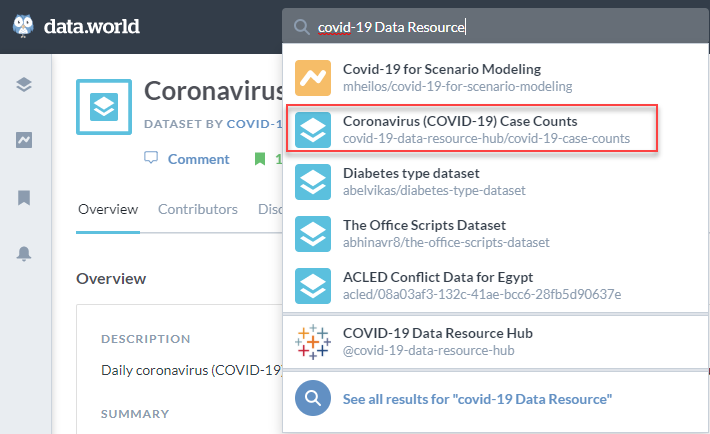
Step 2: Find a Dataset
Once you have access, just search for the COVID-19 dataset from Tableau or click on this link: https://data.world/covid-19-data-resource-hub/covid-19-case-counts
There are also plenty of other useful datasets available. You can search for them in the search bar at the top of the data.world page
Step 3: Open the Dataset
This is how the start page for the COVID-19 dataset looks inside of data.world. From here you can either explore the dataset or open a query.
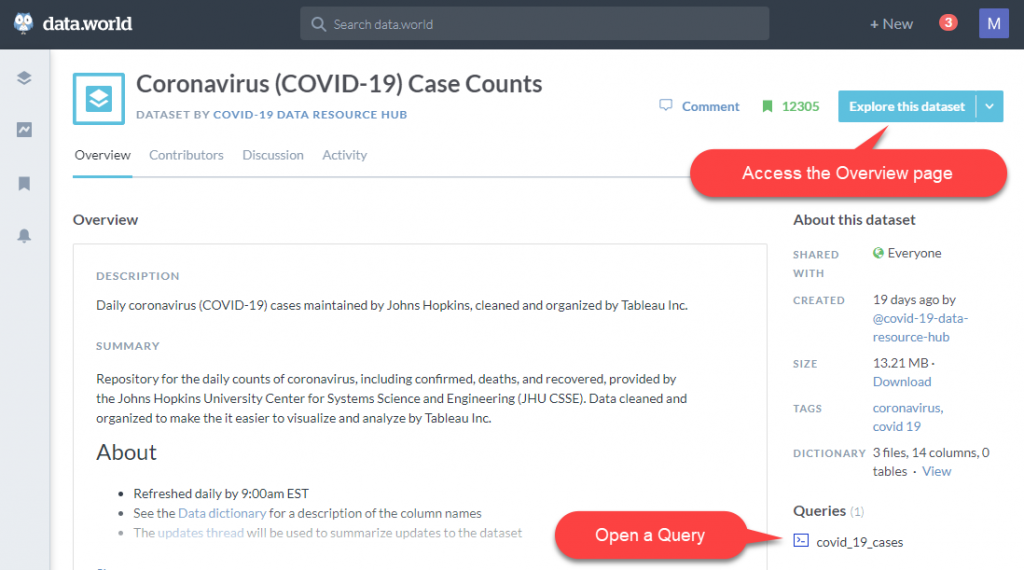
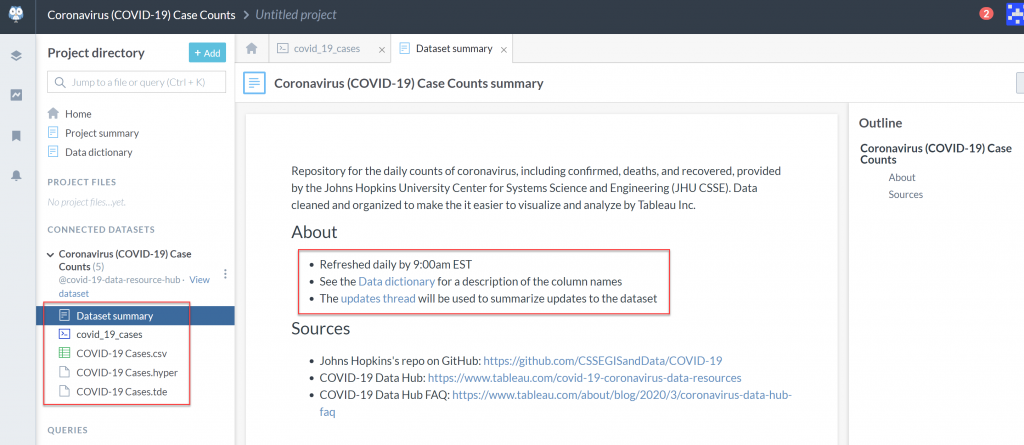
Step 4: Explore the Dataset
This page is really helpful to get started:
- Click on
Dataset summaryto access the data dictionary, timing of the daily refresh cycle, the data sources and other information covid_19_casesopens a basic query to get you started- The
COVID-19 Casesdataset can also be downloaded as .CSV as well as in Tableau’s data formats .HYPER and .TDE
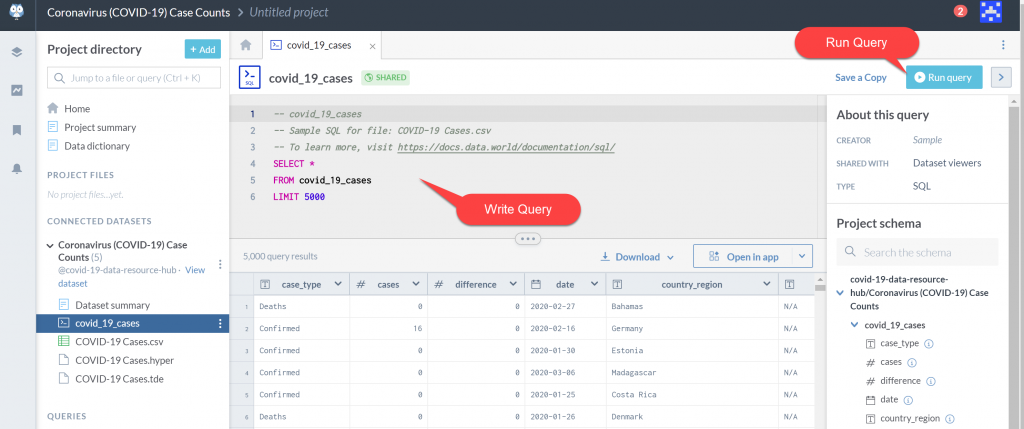
Step 5: Open the Query
The dataset already has a base query to get you started. You can access it from the Explore page or by clicking on the query from the Overview page.
You can write your own queries here and even include data from other datasets (take a look at the next section). Click on the Run Query button to refresh the data.
Please note: it’s good practice to use the LIMIT clause at the end of the statement to reduce the amount of data that data.world needs to retrieve for you. In the screenshot below, the results are limited to 5000 records (by using LIMIT 5000). In most cases it should be enough to set the LIMIT to 100 or 500.
Sample Queries for COVID-19 data
We have prepared a few sample queries that you can leverage to retrieve helpful information quickly. Even if you don’t know SQL, you can run those queries and find some interesting answers and trends.
Cases by State (for US)
Here is a query that lists the absolute number of cases for both confirmed and deaths. It also shows the delta to a previous day and the percentage increase compared to the previous day (you can change it yourself to check on increase over the last 3 days, a week, 10 days etc.).
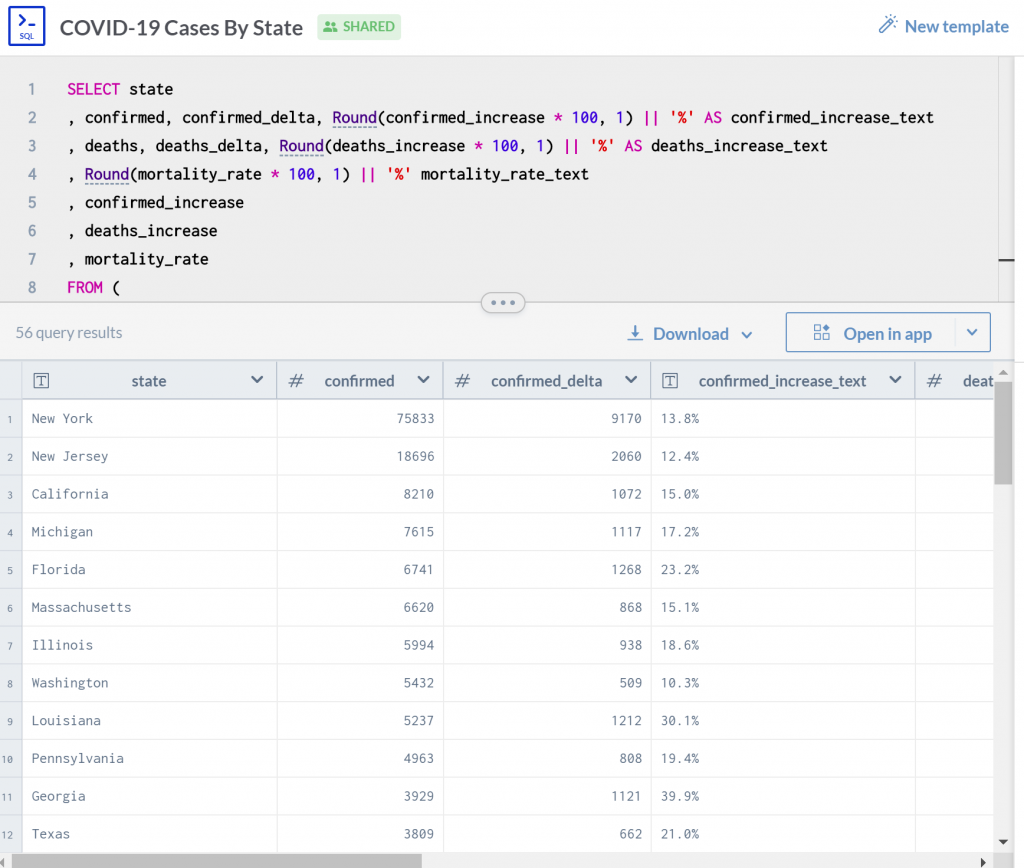
While this query shows data for March 31st vs March 30th, and only for the United States, you can easily change the query to run for a different country or region and different date ranges by updating the following filter:
- Country/Region: WHERE country_region = ‘US’
- Date range: AND date = ‘2020-03-31’
Please note: there are two date filters: one in theday0subquery, another one in thedayxsubquery.
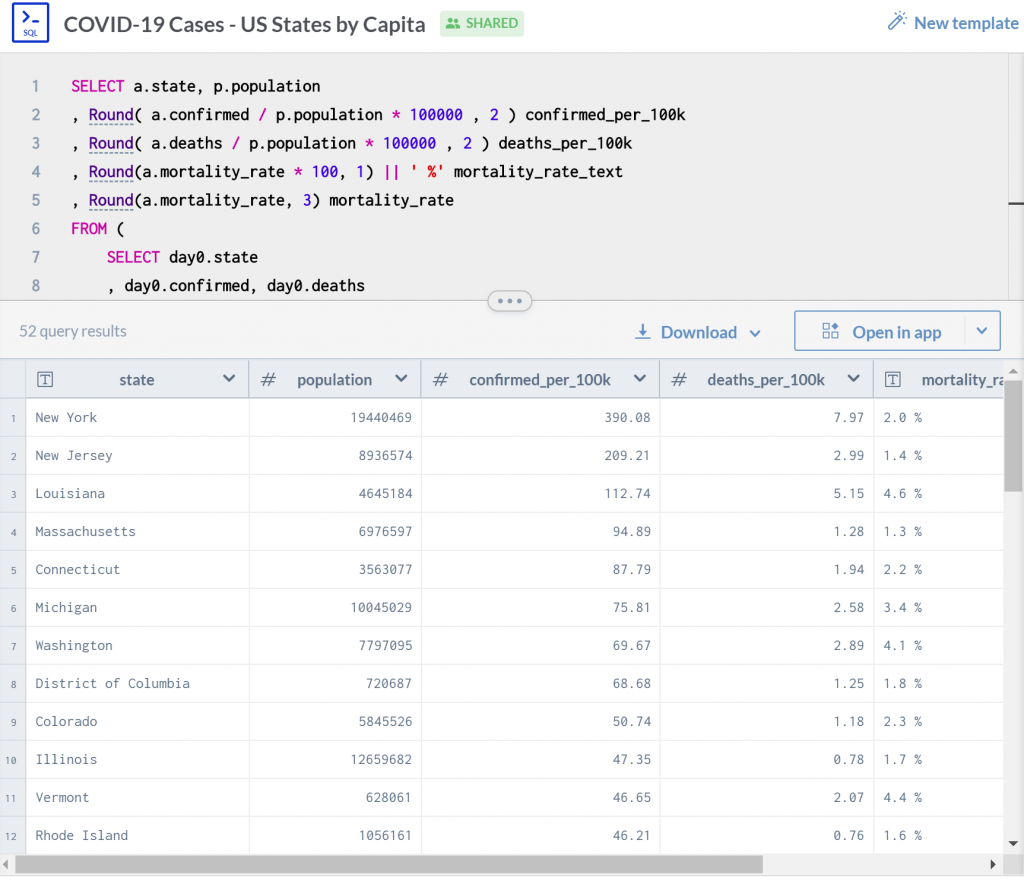
Cases Per Capita (for US States)
With data.world, it is possible to combine datasets – and you can even upload your own.
An interesting KPI is the ratio of cases per capita. Since the dataset from Tableau/Johns Hopkins University does not include population by state/country, you can either reference an existing dataset or upload your own. (FYI: the latest census data I could find was from 2016, so I uploaded a dataset with predictions for 2020 population by state – in case you wonder why the numbers here differ from what you see in the news).
How can I get access to the Sample Queries
There is one query already included with the COVID-19 dataset itself. How to access it is described above.
The queries that are shown above (Cases per State, Cases per Capita) can be downloaded here.
Please note: the Per Capita query will not run if you’re only using the COVID-19 dataset mentioned above. You can add your own population dataset or request access to the project that we’ve created. Just contact us through the website (Contact form at the bottom of the About page), LinkedIn or just email us (if you’re connected to a FinTech team member already). All we need from you is your user name from data.world and we can share our dataset with you so you can run the query as is.
Also, please follow FinTech Innovations on LinkedIn to be notified of any updates to this.
Why is our data.world Project COVID-19 for Scenario Planning not public?
We thought about releasing the project with our sample queries to the public, but the stakes are incredibly high right now. As much effort as Johns Hopkins University and other providers are putting into this, the number of cases which have been captured is most likely not accurate. Therefore, anyone using this data needs to be aware of how it should be used.
We are no experts in statistics, epidemiology, health predictions, scenario planning etc. We do know about data integration and automation and thought we can help by providing some information about how to access the dataset from a technical perspective. Also we wanted to provide a starting point for others to expedite creating queries so you can leverage it for Scenario Planning.
Please be aware that any conclusions from your analysis need to be examined carefully. As a guideline, please read the following article: 10 considerations before you create another chart about COVID-19
Conclusion
We hope this is helpful for you if you’re trying to leverage COVID-19 data. Please don’t hesitate to contact us with any questions.
Other than that, please stay home and follow the official guidelines. Best wishes to all of you, your family and friends to stay healthy or get well soon. We will get through this.